Enterprise Infrastructure Management
Generative research & Usability testing for Dell iDRAC10
COMPANY
Dell Technologies
ROLE
UX Researcher
EXPERTISE
User recruitment, interviews, Screener & protocol development
YEAR
2024

Project description
Dell Technologies wanted to launch Integrated Dell Remote Access Controller(iDRAC10), a next-gen infrastructure management solution - used by globally dispersed system administrators to manage, monitor & update servers.
Timeline
From initial research to final insights - 12 weeks
Background
Dell's Integrated Remote Access Controller (iDRAC) is a built-in chip in Dell PowerEdge servers. It offers a graphical user interface (GUI) that enables system administrators to manage and control Dell servers located in remote data centers without needing physical access. iDRAC lets you perform tasks such as:
Checking the server's health and performance
Installing or updating software
Configuring hardware settings
Troubleshooting issues or errors
Without iDRAC, you would have to physically visit each server's location to perform these tasks, which can be time-consuming and inefficient, especially if the servers are in different places.
How might we?
How might we design an intuitive and user-friendly interface for iDRAC 10 that empowers system administrators to efficiently manage and troubleshoot Dell servers remotely, addressing their pain points and workflow needs?
Process
I followed a 3 step process to complete this project:
Familiarization with iDRAC
I began by gaining a deep understanding of iDRAC through hands-on labs and extensive online research. This initial phase was crucial in familiarizing myself with the system's capabilities, user interface, and common use cases.
Generative Research
To gain deeper understanding of user workflows, identify pain points and challenges
Usability Testing
To evaluate iDRAC 10 interface, assess intuitiveness and usability
Familiarization with iDRAC10
Imagine you are an IT professional responsible for maintaining many servers in a data center or across multiple locations. With iDRAC, you can control and troubleshoot these servers from the comfort of your office or even from home, using just your computer or laptop.

Generative Research
In this phase I covered the following main themes:
User profile and background,
User's troubleshooting process,
Tools & softwares used for alerting & troubleshooting,
User's organizational processes,
User's interaction with iDRAC
Interviews
07 Interviews total (5 users through UserTesting.com and 2 Dell employees). Recruiting the correct participant pool was challenging.
Time
Each interview session lasted for 45 mins each, covering major themes to understand user's needs, pain points and major work flows
Insights
01. Monitoring dashboard
Participants use various tools to monitor server health and performance.
No standard set of tools.
02. Alert configuration
Critical alerts are typically received through email notifications, dashboard alerts (e.g. red flags), or even text messages for high-priority servers.
03. Lifecycle logs
Participants often follow a standard process for troubleshooting, which includes checking dashboards, raising tickets, and escalating issues to vendors or other teams if necessary.
Usability Testing
Goal: To gather feedback on newly designed iDRAC10 troubleshooting flows across 03 flows (identified from insights in generative interviews)
What I did:
Screener development
Protocol development
Participant recruitment and interviews
Data analysis
Interviews
07 Interviews total (4 users through UserTesting.com, 1 Dell employees and 2 UT Data center employees).
Time
I interviewed each interview participant for 45-60 mins each, covering 3 major flows


Task 01: Dashboard Evaluation
Initial thoughts
Things you look for, or maybe expect on this dashboard?
Alert monitoring software— do you use any? Is there a dashboard? How is it used?
Insights
01. Dashboard layout
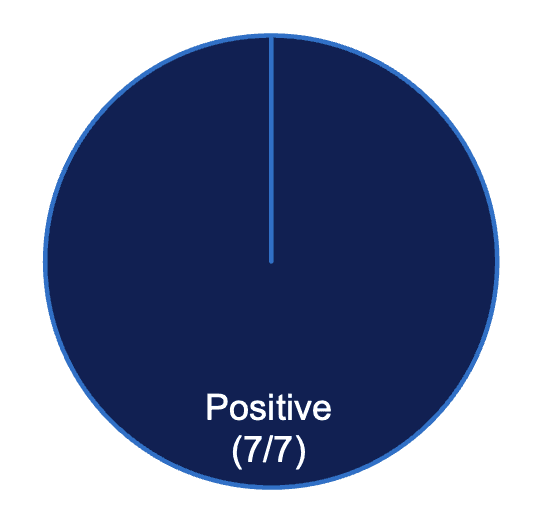
100% have generally positive impressions of the dashboard layout and information presented

02. Key expected elements
(5/7) expect to see system summary and health status on the dashboard

03. Alert monitoring software
(4/7) mention using third-party tools for alert monitoring
(3/5) prefer version A's graphics and layout.
(2/5) appreciate version B's recent logs section and task summary.
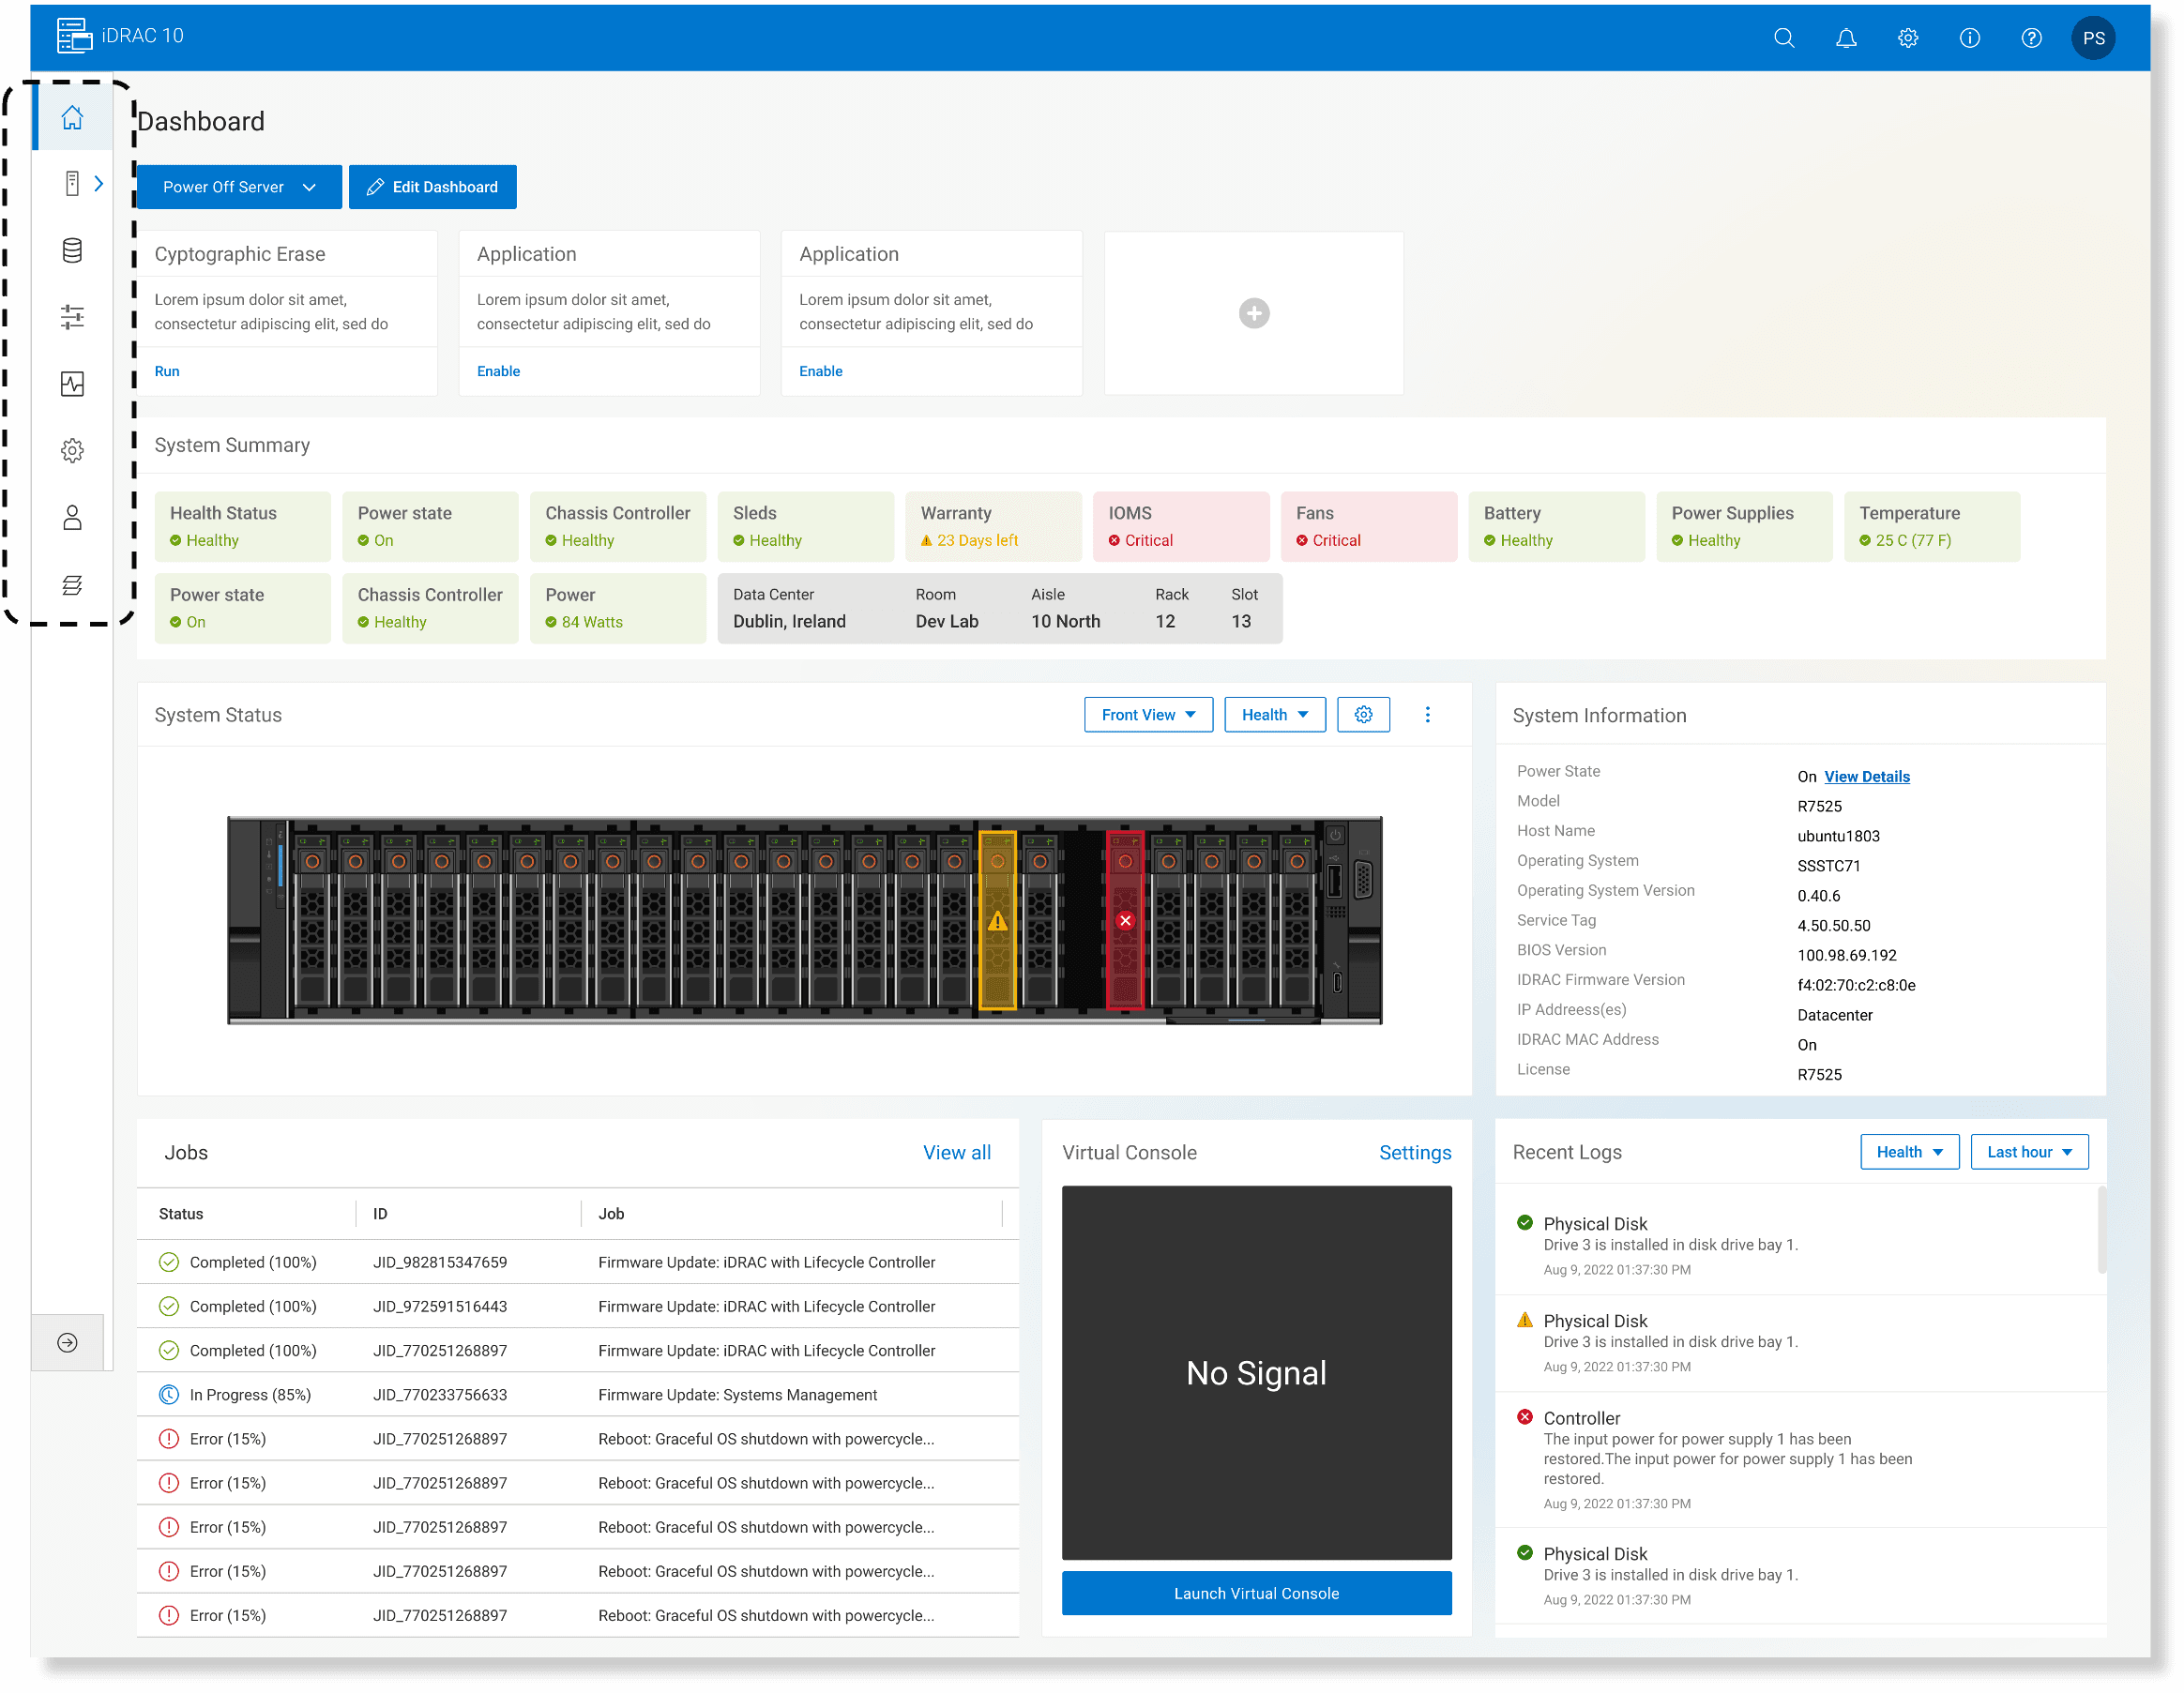
Side Panel
Users did not find the icons in the side panel to be super intuitive
Users expect side panel to be in open state vs closed for easy comprehension
“Side panel - what are these icons? I want that the first time I open the dashboard - I want the side panel to be in open format - I cannot recognize the icons - I want to be able to read the menus….”
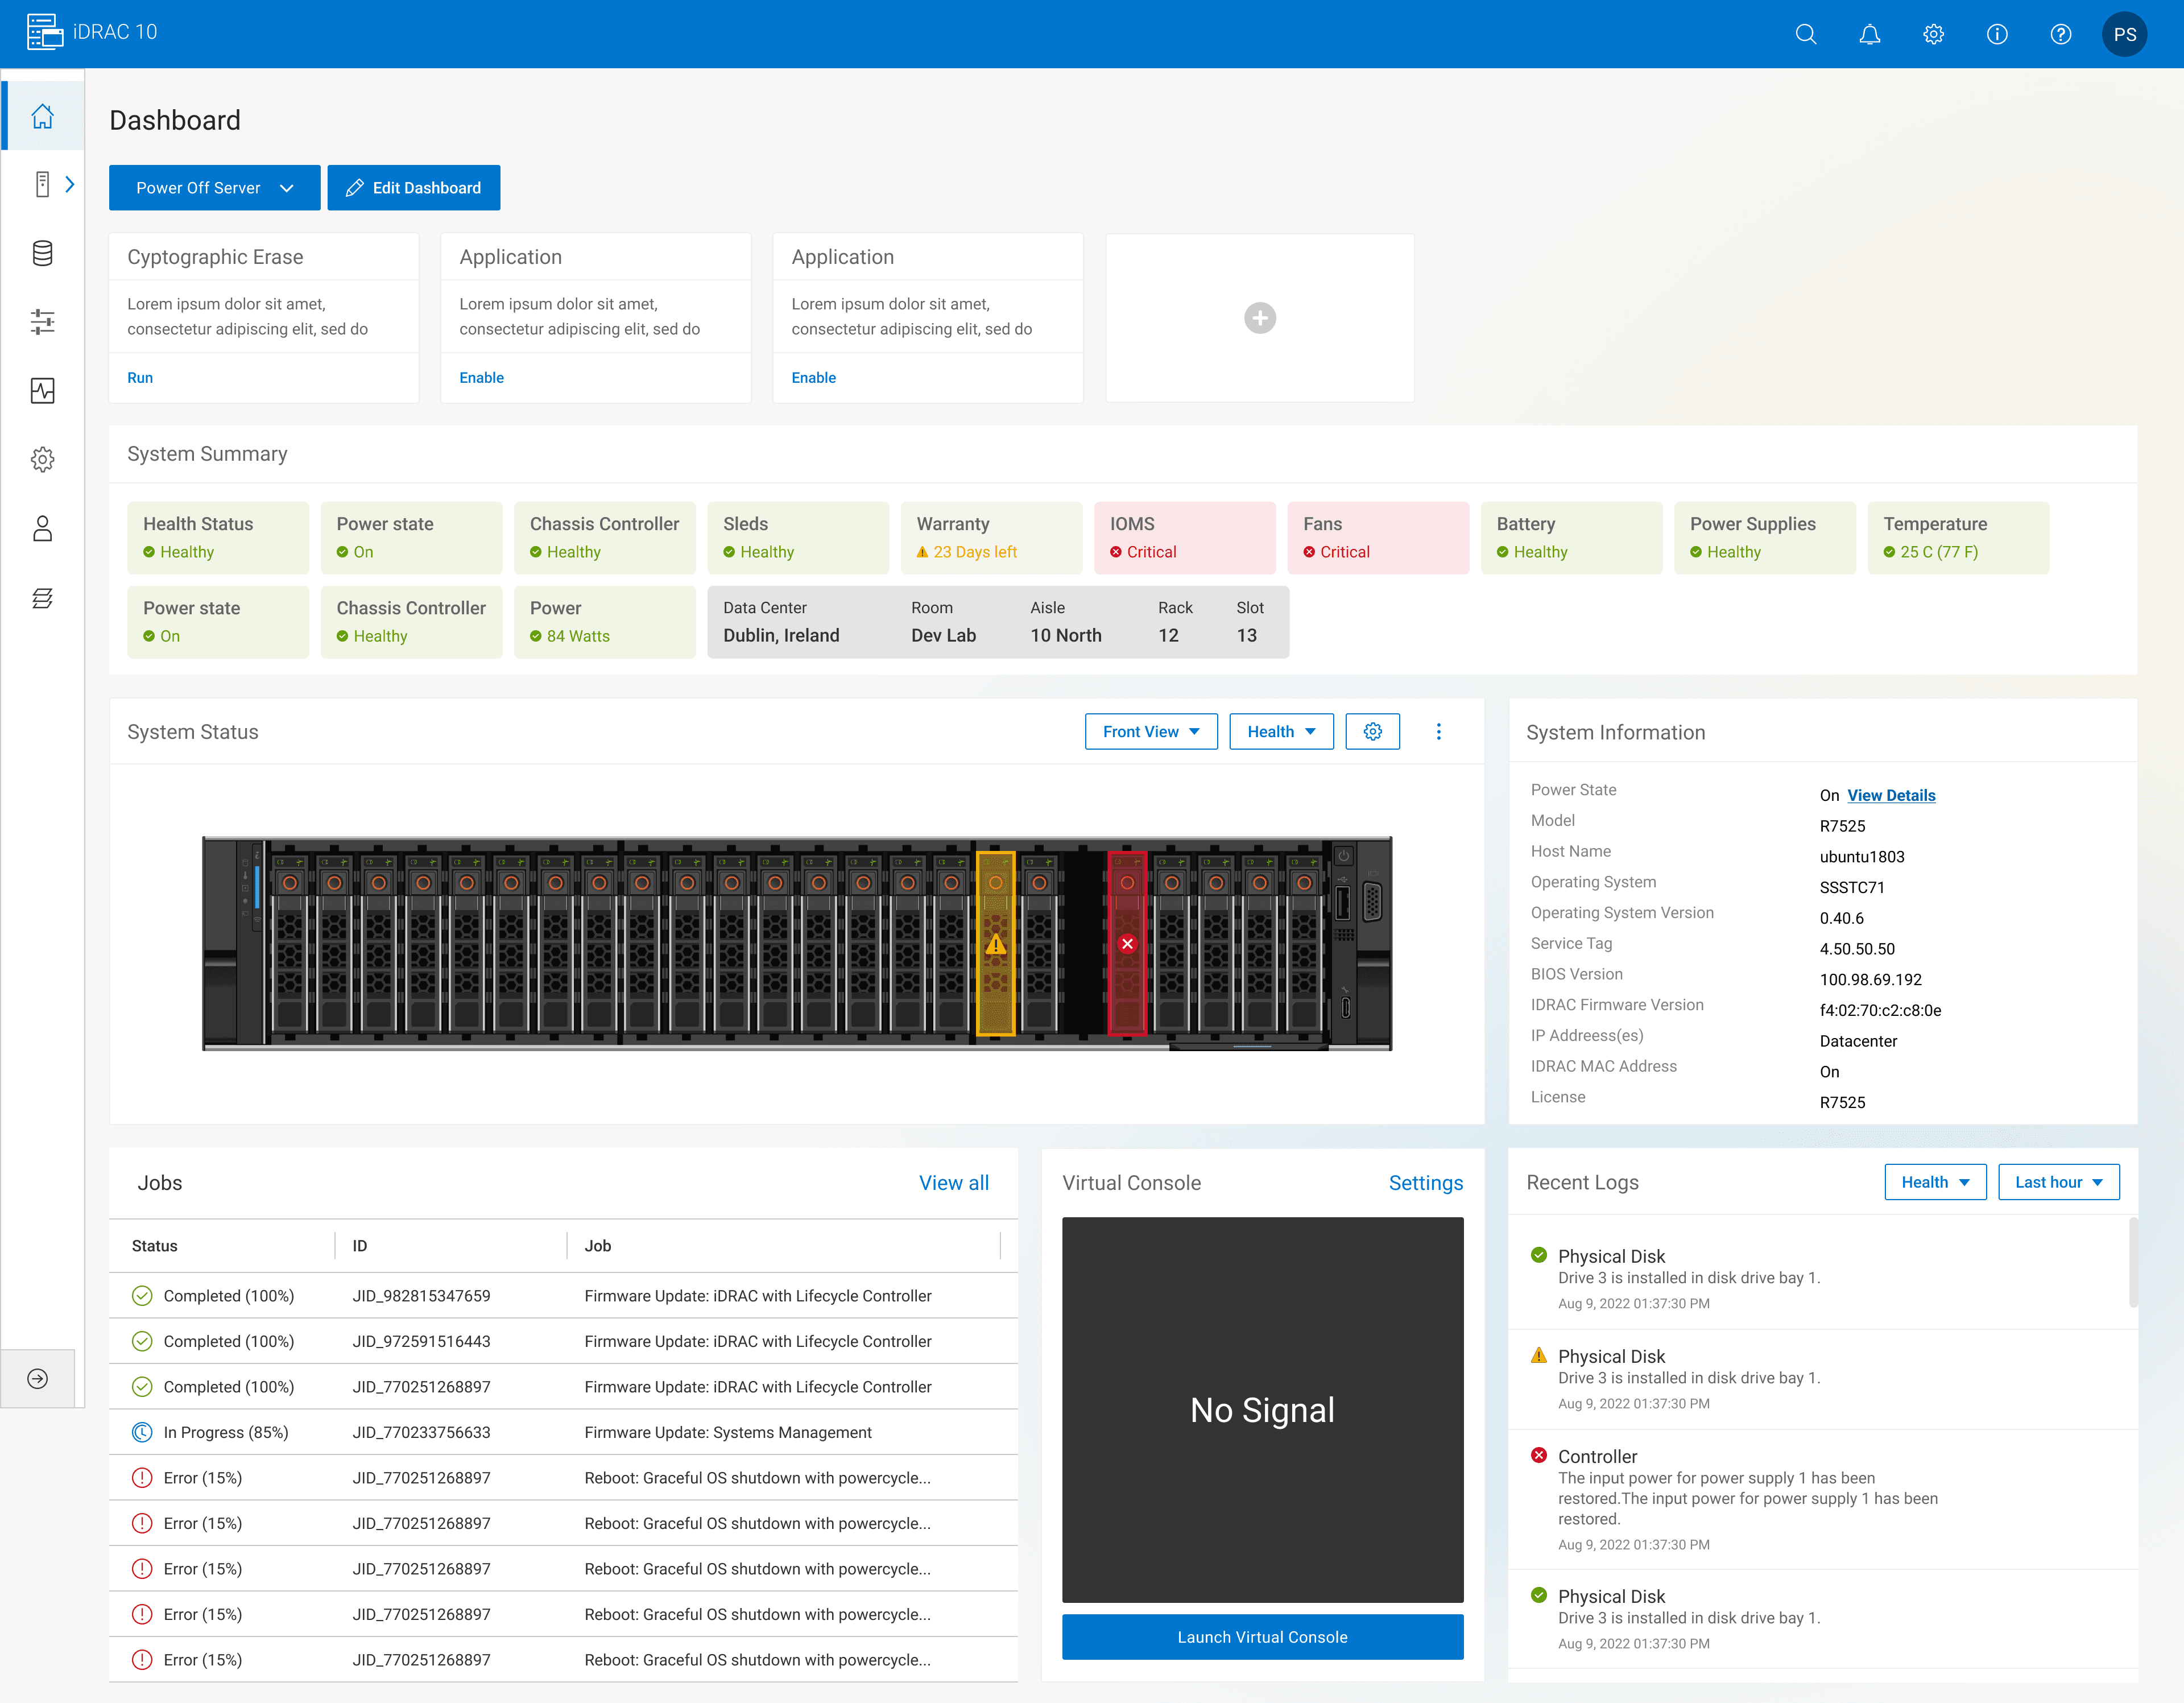
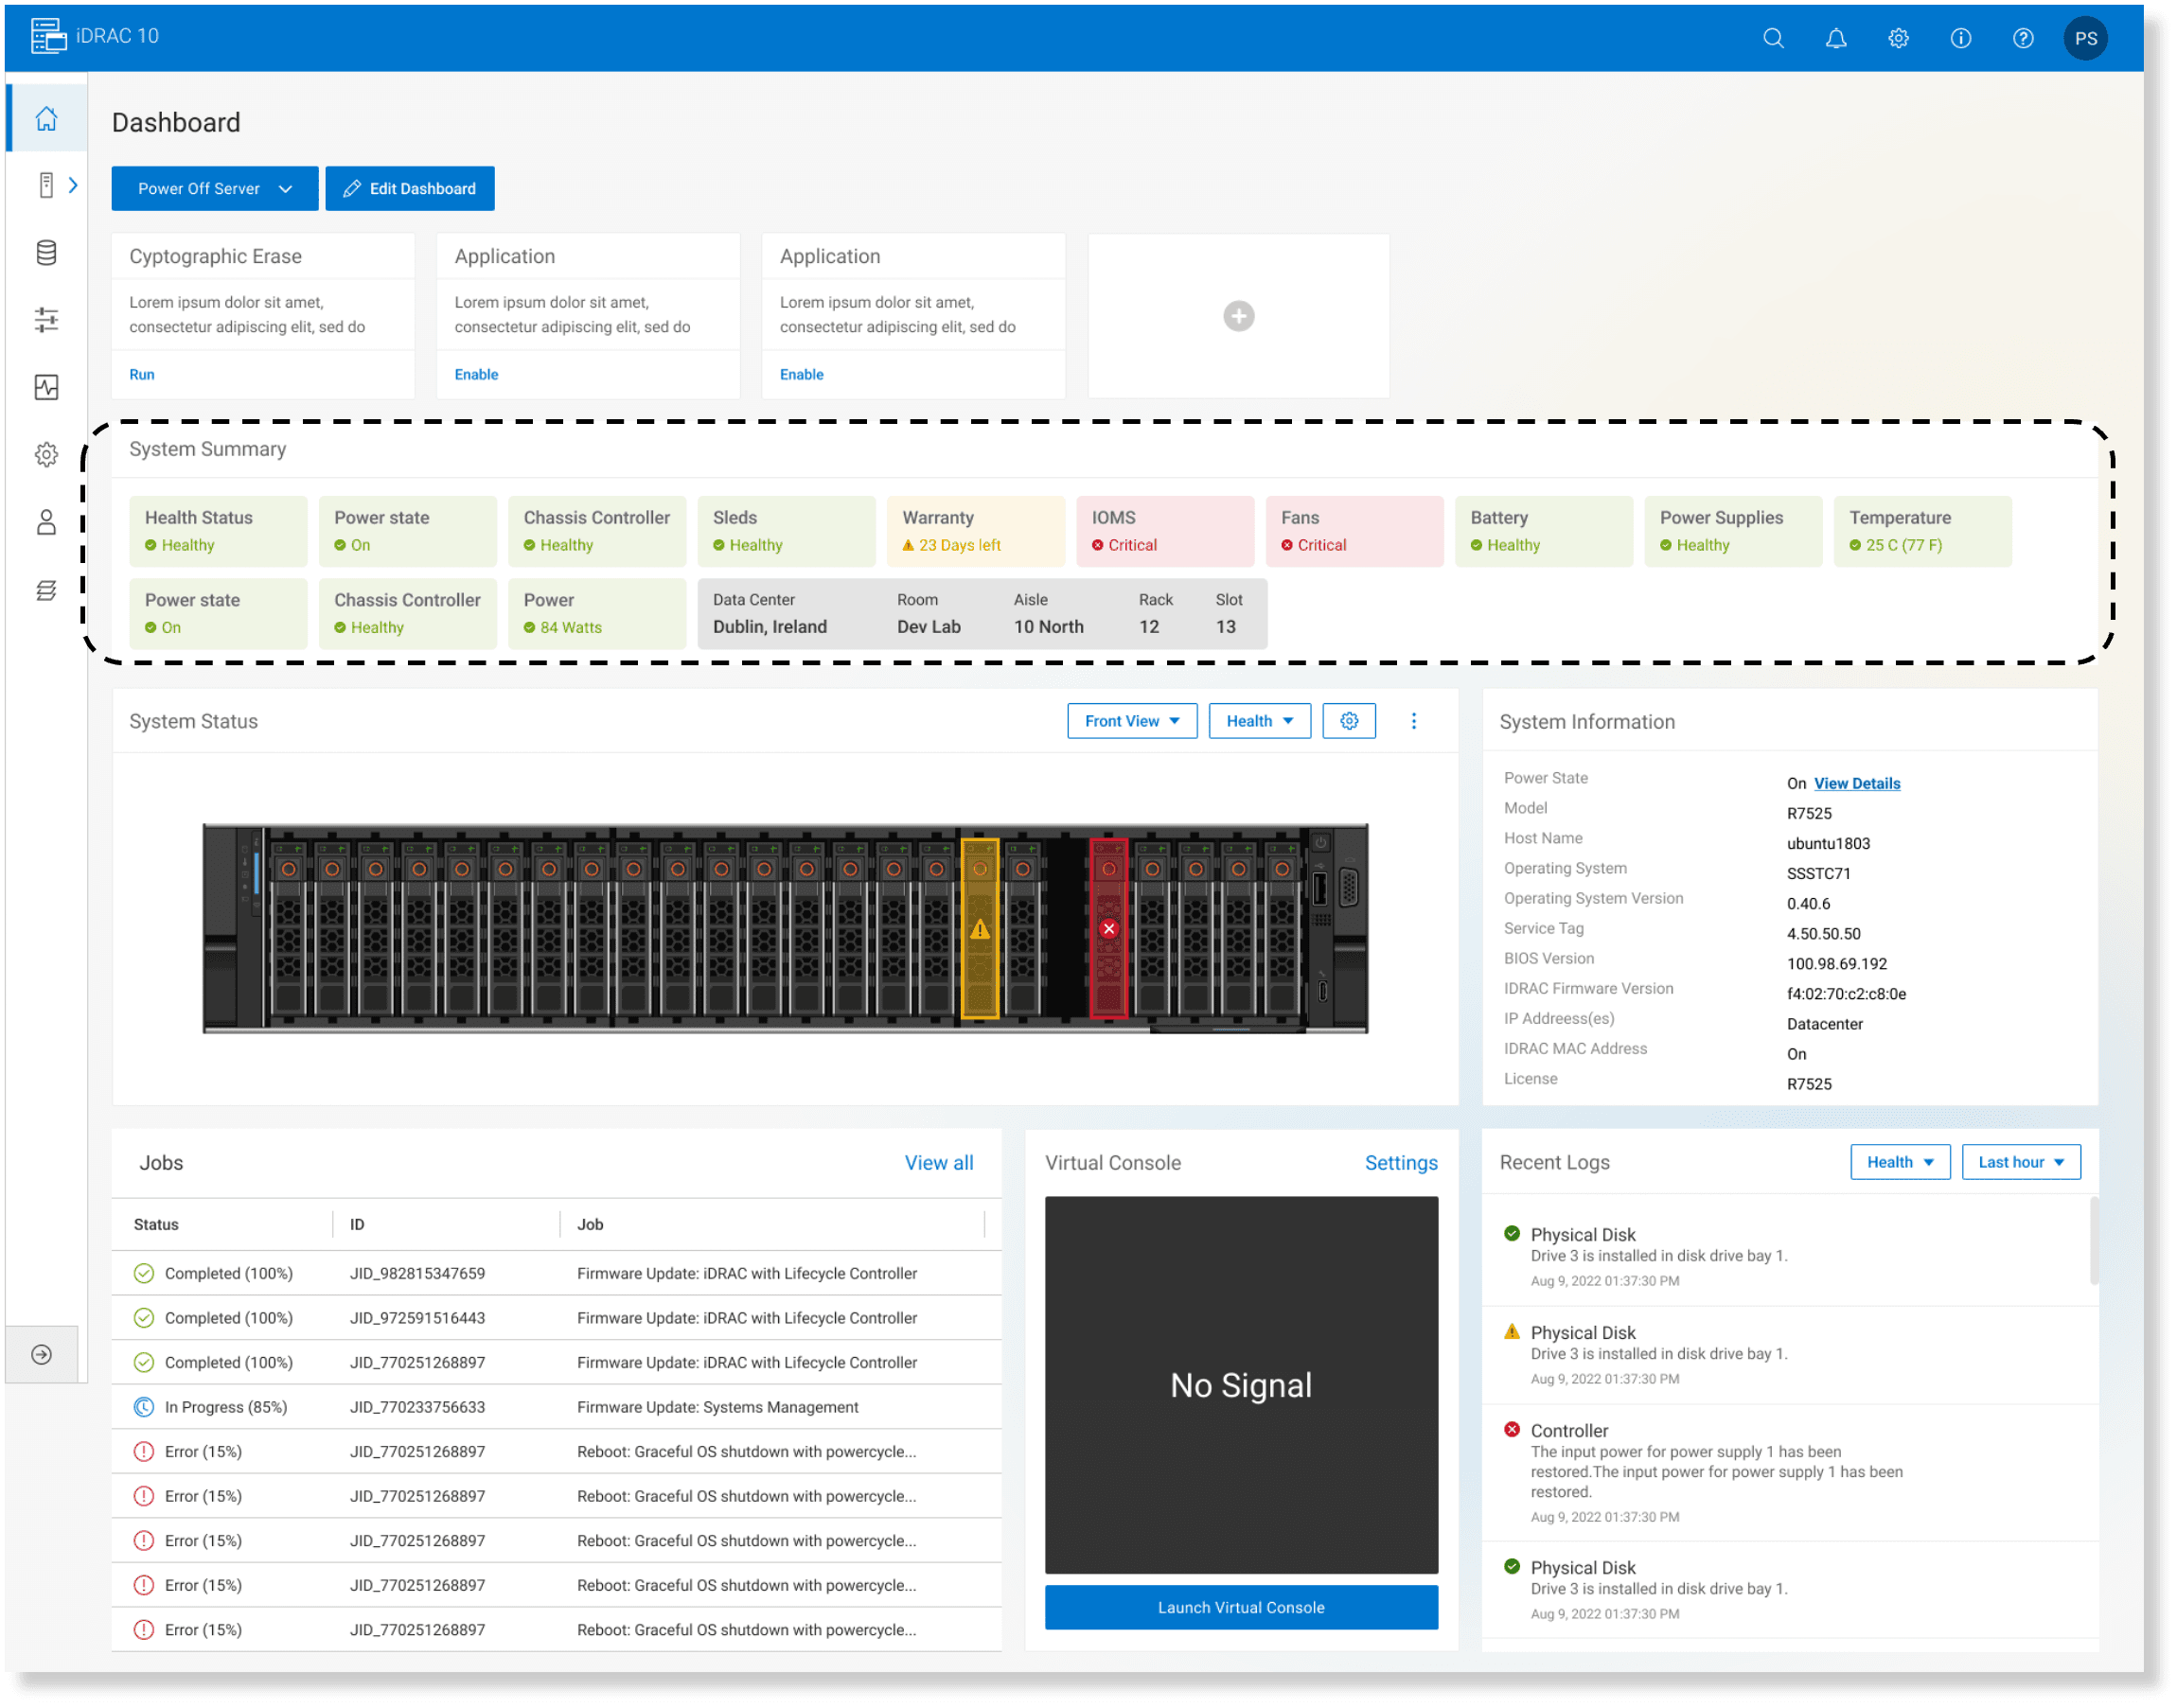
System summary
5/7 Users liked the usage of red, yellow, green to display system summary
“I see the system summary there in all the highlights - which is good shows warnings for things that are failing..... Looks like I can tell quickly that we have some drive errors, fan errors…”
Quicklink cards
5/7 Users were confused what the cards were
“At the top I don’t understand what those cards are for - I would rather see - system summary up here.....”

System status
All users liked the physical server image
1/7 user suggested clickable functionality to be built into the image itself
“It would’ve been great if the physical picture of server could have more functionality to it - like if I clicked on the USB button - it would give more information etc …”

Task 02: Alert Configuration
Creating an Alert: Enable email and IPMI alerts for a physical disk
Location and verbiage
4/7 users experienced some difficulty locating alert settings in UI.
Suggested name change of ’system settings’ to ’alert settings’
“I would expect to see an 'alert' tab as apposed to 'system settings' under configurations. I view system settings as configuring the system....”

Summary cards
2/7 mention confusion regarding the alert configuration summary
“What is the alert configuration summary in red, yellow, green stand for? I don't understand what it means. it looks confusing. it would be helpful to have some informational text on what these 3 categories are....”

Alert configuration details
Users expressed lack of visual confirmation after applying settings.
There is nothing that indicates that alerts are currently active for a certain item
“A confirmation would be great. I kind of hope each item expanded like a drawer for continuity -instead of a side pop up window. it might make scrolling more, but it would give more continuity. from using other UI's that's what I expect...”

Alert configuration
5/7 prefer configuring alerts individually, especially when setting up a small number of servers
“I like applying alerts one by one. For example - if I am going through the whole list, I went through a few items and then get pulled away for something and then the screentime goes out, the whole progress would be lost - it would be annoying..."

Task 03: Lifecycle Logs
Checking Logs: Let's say you noticed an issue when configuring RAID. Check the logs to understand the error.
Log filtering
43% (3/7) suggest improvements to log filtering and searching
“I would like to filter logs by severity, type of logs.... Can I sort the logs from last week, last month instead of date and time? Maybe a button on top - saying ‘Today’,'yesterday',‘Last week’ ‘Last month”

Details
4/7 users prefer longer version of ‘Details’
“Don’t make me click on more stuff, I prefer the first one - longer one”

Recommendations and next steps
Streamline the iDRAC dashboard navigation:
Conduct a comprehensive review of the iDRAC dashboard’s information architecture and navigation structure.
Consider reducing the number of clicks required to access frequently used features and settings.
Enhance the alert configuration workflow:
Update the interface with clear, and consistent terminology to reduce the learning curve for users.
Simplify the alert configuration process by providing more guidance and contextual help for users.
Provide clear confirmation messages and visual feedback when alert settings are successfully applied.
Consider implementing pre-configured alert templates to streamline the setup process.
Optimize the log analysis experience:
Improve the log filtering and search capabilities to help users quickly find relevant information.
Explore ways to better integrate knowledge base articles and troubleshooting guides directly within the iDRAC interface.
Learnings
Mastering complex domains
Overcoming the steep learning curve of understanding the intricate iDRAC system through dedicated research and hands-on exploration.
Resourceful participant recruitment:
Employing creative strategies and leveraging professional networks to identify the ideal participant pool, overcoming initial recruitment challenges
Effective moderation techniques:
Fostering a conducive environment through adaptability, gentle encouragement, and positive affirmations, enabling participants to openly share valuable insights during usability testing sessions.